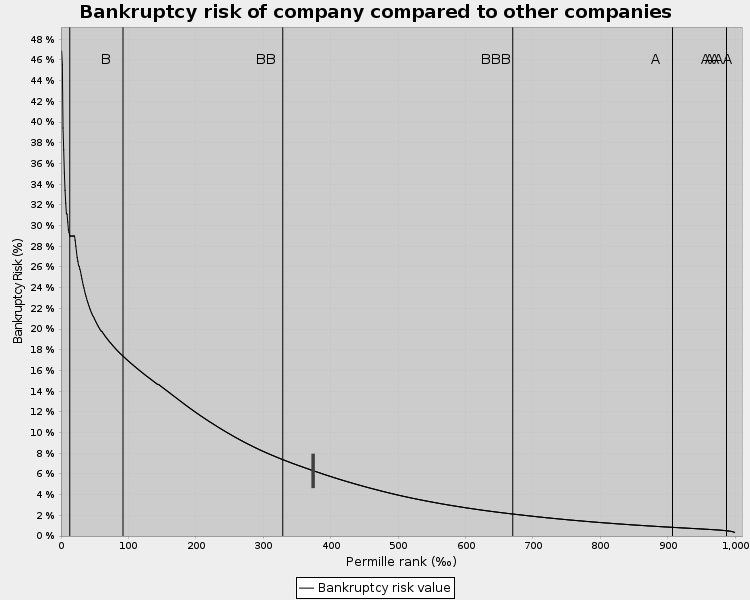
|
1000.0
| Bankruptcy risk for industry | | 2.1% |
2.1% |
2.1% |
2.1% |
2.1% |
2.1% |
2.1% |
2.1% |
|
| Bankruptcy risk | | 3.2% |
11.1% |
12.4% |
5.8% |
5.0% |
8.4% |
17.3% |
17.3% |
|
| Credit score (0-100) | | 57 |
23 |
19 |
38 |
43 |
28 |
9 |
9 |
|
| Credit rating | | BBB |
BB |
BB |
BBB |
BBB |
BB |
BB |
BB |
|
| Credit limit (kDKK) | | 0.0 |
0.0 |
-0.0 |
0.0 |
-0.0 |
-0.0 |
-0.0 |
-0.0 |
|
|
How are these values calculated? |
|
View the automatically generated explanation of bankruptcy risk |
1000.0
|
| Net sales | | 0 |
0 |
0 |
0 |
0 |
0 |
0 |
0 |
|
| Gross profit | | 1,802 |
-321 |
-475 |
140 |
182 |
-186 |
0.0 |
0.0 |
|
| EBITDA | | 1,322 |
-481 |
-799 |
83.9 |
64.5 |
-270 |
0.0 |
0.0 |
|
| EBIT | | 1,222 |
-581 |
-934 |
18.9 |
64.5 |
-270 |
0.0 |
0.0 |
|
| Pre-tax profit (PTP) | | 969.8 |
-1,055.2 |
-593.7 |
-6.9 |
-321.2 |
-482.0 |
0.0 |
0.0 |
|
| Net earnings | | 224.1 |
-986.2 |
-447.7 |
-85.9 |
-391.2 |
-368.0 |
0.0 |
0.0 |
|
| Pre-tax profit without non-rec. items | | 970 |
-1,055 |
-594 |
-6.9 |
-321 |
-482 |
0.0 |
0.0 |
|
|
|
See the entire income statement |
1000.0
|
| Tangible assets total | | 300 |
200 |
325 |
0.0 |
0.0 |
0.0 |
0.0 |
0.0 |
|
| Shareholders equity total | | 1,743 |
757 |
309 |
223 |
-168 |
-536 |
-661 |
-661 |
|
| Interest-bearing liabilities | | 12,540 |
12,315 |
13,155 |
12,961 |
13,803 |
14,661 |
661 |
661 |
|
| Balance sheet total (assets) | | 14,716 |
13,296 |
13,963 |
13,688 |
13,936 |
14,562 |
0.0 |
0.0 |
|
|
| Net Debt | | 12,513 |
12,288 |
13,111 |
12,841 |
13,646 |
14,655 |
661 |
661 |
|
|
See the entire balance sheet |
1000.0
|
| Net sales | | 0 |
0 |
0 |
0 |
0 |
0 |
0 |
0 |
|
| Net sales growth | | 0.0% |
0.0% |
0.0% |
0.0% |
0.0% |
0.0% |
0.0% |
0.0% |
|
| Gross profit | | 1,802 |
-321 |
-475 |
140 |
182 |
-186 |
0.0 |
0.0 |
|
| Gross profit growth | | 107.5% |
0.0% |
-47.9% |
0.0% |
29.6% |
0.0% |
0.0% |
0.0% |
|
| Employees | | 2 |
1 |
3 |
1 |
1 |
1 |
0 |
0 |
|
| Employee growth % | | -33.3% |
-50.0% |
200.0% |
-66.7% |
0.0% |
0.0% |
-100.0% |
0.0% |
|
| Employee expenses | | 0.0 |
0.0 |
0.0 |
0.0 |
0.0 |
0.0 |
0.0 |
0.0 |
|
| Balance sheet total (assets) | | 14,716 |
13,296 |
13,963 |
13,688 |
13,936 |
14,562 |
0 |
0 |
|
| Balance sheet change% | | -4.2% |
-9.6% |
5.0% |
-2.0% |
1.8% |
4.5% |
-100.0% |
0.0% |
|
| Added value | | 1,322.3 |
-480.8 |
-798.8 |
83.9 |
129.5 |
-270.3 |
0.0 |
0.0 |
|
| Added value % | | 0.0% |
0.0% |
0.0% |
0.0% |
0.0% |
0.0% |
0.0% |
0.0% |
|
| Investments | | -200 |
-200 |
-10 |
-390 |
0 |
0 |
0 |
0 |
|
|
| Net sales trend | | 0.0 |
0.0 |
0.0 |
0.0 |
0.0 |
0.0 |
0.0 |
0.0 |
|
| EBIT trend | | 1.0 |
-1.0 |
-2.0 |
1.0 |
2.0 |
-1.0 |
0.0 |
0.0 |
|
1000.0
| EBITDA % | | 0.0% |
0.0% |
0.0% |
0.0% |
0.0% |
0.0% |
0.0% |
0.0% |
|
| EBIT % | | 0.0% |
0.0% |
0.0% |
0.0% |
0.0% |
0.0% |
0.0% |
0.0% |
|
| EBIT to gross profit (%) | | 67.8% |
181.0% |
196.7% |
13.5% |
35.5% |
144.9% |
0.0% |
0.0% |
|
| Net Earnings % | | 0.0% |
0.0% |
0.0% |
0.0% |
0.0% |
0.0% |
0.0% |
0.0% |
|
| Profit before depreciation and extraordinary items % | | 0.0% |
0.0% |
0.0% |
0.0% |
0.0% |
0.0% |
0.0% |
0.0% |
|
| Pre tax profit less extraordinaries % | | 0.0% |
0.0% |
0.0% |
0.0% |
0.0% |
0.0% |
0.0% |
0.0% |
|
| ROA % | | 8.4% |
-5.7% |
-2.5% |
1.8% |
-0.3% |
2.4% |
0.0% |
0.0% |
|
| ROI % | | 8.6% |
-5.9% |
-2.5% |
1.9% |
-0.4% |
2.4% |
0.0% |
0.0% |
|
| ROE % | | 13.7% |
-78.9% |
-84.0% |
-32.3% |
-5.5% |
-2.6% |
0.0% |
0.0% |
|
1000.0
| Equity ratio % | | 11.8% |
5.7% |
2.2% |
1.6% |
-1.2% |
-3.6% |
-100.0% |
-100.0% |
|
| Relative indebtedness % | | 0.0% |
0.0% |
0.0% |
0.0% |
0.0% |
0.0% |
0.0% |
0.0% |
|
| Relative net indebtedness % | | 0.0% |
0.0% |
0.0% |
0.0% |
0.0% |
0.0% |
0.0% |
0.0% |
|
| Net int. bear. debt to EBITDA, % | | 946.3% |
-2,555.4% |
-1,641.5% |
15,304.8% |
21,143.1% |
-5,421.3% |
0.0% |
0.0% |
|
| Gearing % | | 719.5% |
1,627.4% |
4,256.6% |
5,807.9% |
-8,211.9% |
-2,735.0% |
-100.0% |
-100.0% |
|
| Net interest | | 0 |
0 |
0 |
0 |
0 |
0 |
0 |
0 |
|
| Financing costs % | | 2.2% |
2.0% |
2.0% |
2.0% |
2.0% |
5.8% |
0.0% |
0.0% |
|
1000.0
| Quick Ratio | | 1.1 |
1.0 |
0.9 |
1.0 |
0.9 |
0.9 |
0.0 |
0.0 |
|
| Current Ratio | | 1.1 |
1.0 |
0.9 |
1.0 |
0.9 |
0.9 |
0.0 |
0.0 |
|
| Cash and cash equivalent | | 27.0 |
27.9 |
44.0 |
119.5 |
157.2 |
5.5 |
0.0 |
0.0 |
|
1000.0
| Trade debtors turnover (days) | | 0.0 |
0.0 |
0.0 |
0.0 |
0.0 |
0.0 |
0.0 |
0.0 |
|
| Trade creditors turnover (days) | | 0.0 |
0.0 |
0.0 |
0.0 |
0.0 |
0.0 |
0.0 |
0.0 |
|
| Current assets / Net sales % | | 0.0% |
0.0% |
0.0% |
0.0% |
0.0% |
0.0% |
0.0% |
0.0% |
|
| Net working capital | | 773.0 |
20.8 |
-876.1 |
-353.7 |
-759.7 |
-1,049.2 |
-330.5 |
-330.5 |
|
| Net working capital % | | 0.0% |
0.0% |
0.0% |
0.0% |
0.0% |
0.0% |
0.0% |
0.0% |
|
1000.0
| Net sales / employee | | 0 |
0 |
0 |
0 |
0 |
0 |
0 |
0 |
|
| Added value / employee | | 661 |
-481 |
-266 |
84 |
130 |
-270 |
0 |
0 |
|
| Employee expenses / employee | | 0 |
0 |
0 |
0 |
0 |
0 |
0 |
0 |
|
| EBITDA / employee | | 661 |
-481 |
-266 |
84 |
65 |
-270 |
0 |
0 |
|
| EBIT / employee | | 611 |
-581 |
-311 |
19 |
65 |
-270 |
0 |
0 |
|
| Net earnings / employee | | 112 |
-986 |
-149 |
-86 |
-391 |
-368 |
0 |
0 |
|
|