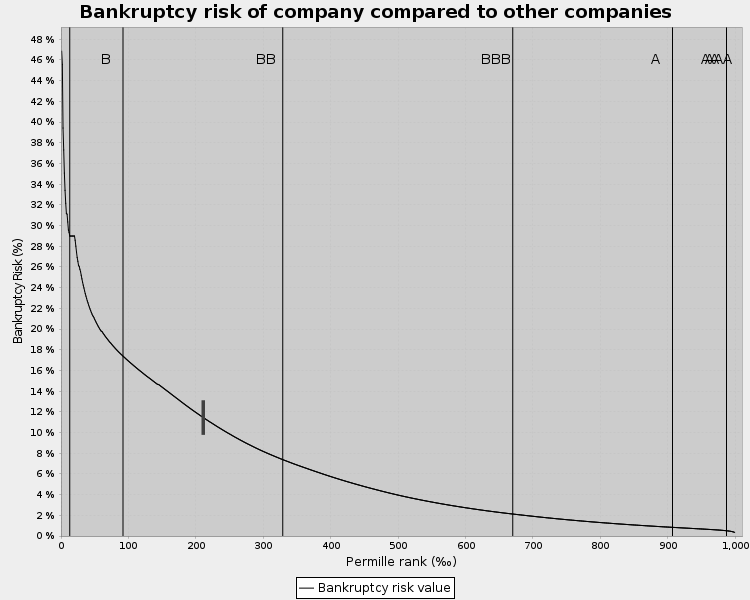
|
1000.0
| Bankruptcy risk for industry | | 2.4% |
2.4% |
2.4% |
2.4% |
2.4% |
2.4% |
2.4% |
2.4% |
|
| Bankruptcy risk | | 0.6% |
0.9% |
1.1% |
1.0% |
1.5% |
1.2% |
8.8% |
8.8% |
|
| Credit score (0-100) | | 97 |
91 |
84 |
85 |
76 |
80 |
28 |
28 |
|
| Credit rating | | AA |
A |
A |
A |
A |
A |
BB |
BB |
|
| Credit limit (kDKK) | | 1,754.0 |
669.8 |
485.3 |
651.4 |
65.9 |
415.9 |
0.0 |
0.0 |
|
|
How are these values calculated? |
|
View the automatically generated explanation of bankruptcy risk |
1000.0
|
| Net sales | | 0 |
0 |
0 |
0 |
0 |
0 |
0 |
0 |
|
| Gross profit | | 8,737 |
6,121 |
6,948 |
7,778 |
9,022 |
9,690 |
0.0 |
0.0 |
|
| EBITDA | | 5,269 |
5,235 |
6,053 |
6,387 |
8,027 |
8,462 |
0.0 |
0.0 |
|
| EBIT | | 4,391 |
4,778 |
5,669 |
5,999 |
7,896 |
8,350 |
0.0 |
0.0 |
|
| Pre-tax profit (PTP) | | 5,249.1 |
5,484.4 |
5,672.2 |
5,740.4 |
8,535.8 |
10,008.9 |
0.0 |
0.0 |
|
| Net earnings | | 4,088.2 |
4,263.7 |
4,416.4 |
4,451.3 |
6,601.3 |
7,804.6 |
0.0 |
0.0 |
|
| Pre-tax profit without non-rec. items | | 5,249 |
5,484 |
5,672 |
5,740 |
8,536 |
10,009 |
0.0 |
0.0 |
|
|
|
See the entire income statement |
1000.0
|
| Tangible assets total | | 1,156 |
1,085 |
1,223 |
696 |
670 |
773 |
0.0 |
0.0 |
|
| Shareholders equity total | | 13,140 |
5,404 |
5,820 |
6,271 |
8,873 |
10,677 |
4,552 |
4,552 |
|
| Interest-bearing liabilities | | 642 |
938 |
1,038 |
101 |
1,494 |
129 |
0.0 |
0.0 |
|
| Balance sheet total (assets) | | 22,279 |
9,919 |
11,364 |
12,946 |
18,649 |
18,316 |
4,552 |
4,552 |
|
|
| Net Debt | | -16,836 |
846 |
-7,101 |
-9,433 |
-11,127 |
-5,559 |
-4,552 |
-4,552 |
|
|
See the entire balance sheet |
1000.0
|
| Net sales | | 0 |
0 |
0 |
0 |
0 |
0 |
0 |
0 |
|
| Net sales growth | | 0.0% |
0.0% |
0.0% |
0.0% |
0.0% |
0.0% |
0.0% |
0.0% |
|
| Gross profit | | 8,737 |
6,121 |
6,948 |
7,778 |
9,022 |
9,690 |
0.0 |
0.0 |
|
| Gross profit growth | | 30.8% |
-29.9% |
13.5% |
11.9% |
16.0% |
7.4% |
-100.0% |
0.0% |
|
| Employees | | 1 |
2 |
2 |
2 |
2 |
2 |
0 |
0 |
|
| Employee growth % | | -50.0% |
100.0% |
0.0% |
0.0% |
0.0% |
0.0% |
-100.0% |
0.0% |
|
| Employee expenses | | 0.0 |
0.0 |
0.0 |
0.0 |
0.0 |
0.0 |
0.0 |
0.0 |
|
| Balance sheet total (assets) | | 22,279 |
9,919 |
11,364 |
12,946 |
18,649 |
18,316 |
4,552 |
4,552 |
|
| Balance sheet change% | | 30.1% |
-55.5% |
14.6% |
13.9% |
44.1% |
-1.8% |
-75.1% |
0.0% |
|
| Added value | | 5,268.6 |
5,234.9 |
6,053.2 |
6,387.4 |
8,284.6 |
8,461.9 |
0.0 |
0.0 |
|
| Added value % | | 0.0% |
0.0% |
0.0% |
0.0% |
0.0% |
0.0% |
0.0% |
0.0% |
|
| Investments | | -3,459 |
-527 |
-246 |
-916 |
-157 |
-9 |
-773 |
0 |
|
|
| Net sales trend | | 0.0 |
0.0 |
0.0 |
0.0 |
0.0 |
0.0 |
0.0 |
0.0 |
|
| EBIT trend | | 3.0 |
4.0 |
5.0 |
5.0 |
5.0 |
5.0 |
0.0 |
0.0 |
|
1000.0
| EBITDA % | | 0.0% |
0.0% |
0.0% |
0.0% |
0.0% |
0.0% |
0.0% |
0.0% |
|
| EBIT % | | 0.0% |
0.0% |
0.0% |
0.0% |
0.0% |
0.0% |
0.0% |
0.0% |
|
| EBIT to gross profit (%) | | 50.3% |
78.1% |
81.6% |
77.1% |
87.5% |
86.2% |
0.0% |
0.0% |
|
| Net Earnings % | | 0.0% |
0.0% |
0.0% |
0.0% |
0.0% |
0.0% |
0.0% |
0.0% |
|
| Profit before depreciation and extraordinary items % | | 0.0% |
0.0% |
0.0% |
0.0% |
0.0% |
0.0% |
0.0% |
0.0% |
|
| Pre tax profit less extraordinaries % | | 0.0% |
0.0% |
0.0% |
0.0% |
0.0% |
0.0% |
0.0% |
0.0% |
|
| ROA % | | 26.7% |
34.8% |
53.3% |
50.0% |
54.6% |
54.2% |
0.0% |
0.0% |
|
| ROI % | | 44.1% |
55.6% |
85.8% |
91.8% |
103.1% |
94.6% |
0.0% |
0.0% |
|
| ROE % | | 36.8% |
46.0% |
78.7% |
73.6% |
87.2% |
79.8% |
0.0% |
0.0% |
|
1000.0
| Equity ratio % | | 59.0% |
54.5% |
51.2% |
48.4% |
47.8% |
58.6% |
100.0% |
100.0% |
|
| Relative indebtedness % | | 0.0% |
0.0% |
0.0% |
0.0% |
0.0% |
0.0% |
0.0% |
0.0% |
|
| Relative net indebtedness % | | 0.0% |
0.0% |
0.0% |
0.0% |
0.0% |
0.0% |
0.0% |
0.0% |
|
| Net int. bear. debt to EBITDA, % | | -319.6% |
16.2% |
-117.3% |
-147.7% |
-138.6% |
-65.7% |
0.0% |
0.0% |
|
| Gearing % | | 4.9% |
17.3% |
17.8% |
1.6% |
16.8% |
1.2% |
0.0% |
0.0% |
|
| Net interest | | 0 |
0 |
0 |
0 |
0 |
0 |
0 |
0 |
|
| Financing costs % | | 2.9% |
15.2% |
0.0% |
59.3% |
11.2% |
0.3% |
0.0% |
0.0% |
|
1000.0
| Quick Ratio | | 2.3 |
2.7 |
2.4 |
1.8 |
1.9 |
2.3 |
0.0 |
0.0 |
|
| Current Ratio | | 2.3 |
2.7 |
2.4 |
1.8 |
1.8 |
2.3 |
0.0 |
0.0 |
|
| Cash and cash equivalent | | 17,478.5 |
91.9 |
8,138.0 |
9,534.1 |
12,620.6 |
5,687.3 |
0.0 |
0.0 |
|
1000.0
| Trade debtors turnover (days) | | 0.0 |
0.0 |
0.0 |
0.0 |
0.0 |
0.0 |
0.0 |
0.0 |
|
| Trade creditors turnover (days) | | 0.0 |
0.0 |
0.0 |
0.0 |
0.0 |
0.0 |
0.0 |
0.0 |
|
| Current assets / Net sales % | | 0.0% |
0.0% |
0.0% |
0.0% |
0.0% |
0.0% |
0.0% |
0.0% |
|
| Net working capital | | -1,943.1 |
5,574.7 |
5,864.5 |
1,235.7 |
2,936.3 |
9,903.9 |
0.0 |
0.0 |
|
| Net working capital % | | 0.0% |
0.0% |
0.0% |
0.0% |
0.0% |
0.0% |
0.0% |
0.0% |
|
1000.0
| Net sales / employee | | 0 |
0 |
0 |
0 |
0 |
0 |
0 |
0 |
|
| Added value / employee | | 5,269 |
2,617 |
3,027 |
3,194 |
4,142 |
4,231 |
0 |
0 |
|
| Employee expenses / employee | | 0 |
0 |
0 |
0 |
0 |
0 |
0 |
0 |
|
| EBITDA / employee | | 5,269 |
2,617 |
3,027 |
3,194 |
4,014 |
4,231 |
0 |
0 |
|
| EBIT / employee | | 4,391 |
2,389 |
2,835 |
2,999 |
3,948 |
4,175 |
0 |
0 |
|
| Net earnings / employee | | 4,088 |
2,132 |
2,208 |
2,226 |
3,301 |
3,902 |
0 |
0 |
|
|