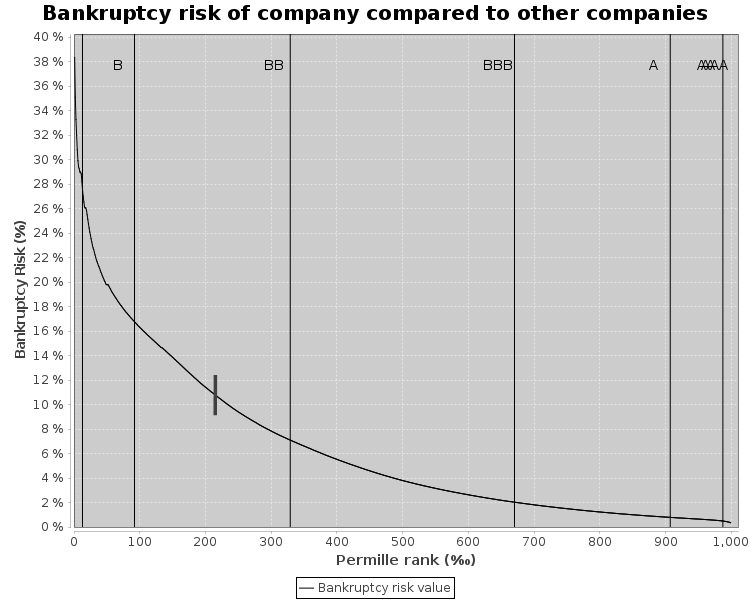
|
1000.0
| Bankruptcy risk for industry | | 3.3% |
3.3% |
3.3% |
3.3% |
3.3% |
3.3% |
3.3% |
3.3% |
|
| Bankruptcy risk | | 18.2% |
8.8% |
12.0% |
11.0% |
10.8% |
8.0% |
17.8% |
17.8% |
|
| Credit score (0-100) | | 9 |
29 |
20 |
21 |
22 |
29 |
9 |
9 |
|
| Credit rating | | B |
BB |
BB |
BB |
BB |
BB |
B |
B |
|
| Credit limit (kDKK) | | -0.0 |
-0.0 |
-0.0 |
-0.0 |
-0.0 |
-0.0 |
-0.0 |
-0.0 |
|
|
How are these values calculated? |
|
View the automatically generated explanation of bankruptcy risk |
1000.0
|
| Net sales | | 0 |
0 |
0 |
0 |
0 |
0 |
0 |
0 |
|
| Gross profit | | -226 |
1,024 |
-1,147 |
1,139 |
1,131 |
1,564 |
0.0 |
0.0 |
|
| EBITDA | | -1,716 |
873 |
-1,807 |
-1,876 |
-2,670 |
-2,911 |
0.0 |
0.0 |
|
| EBIT | | -3,495 |
-1,532 |
-4,790 |
-5,183 |
-6,127 |
-6,534 |
0.0 |
0.0 |
|
| Pre-tax profit (PTP) | | -5,404.8 |
-3,619.9 |
-6,836.6 |
-6,986.5 |
-8,433.8 |
-9,291.9 |
0.0 |
0.0 |
|
| Net earnings | | -4,423.7 |
-2,790.8 |
-6,112.8 |
-6,216.8 |
-7,529.5 |
-8,212.9 |
0.0 |
0.0 |
|
| Pre-tax profit without non-rec. items | | -5,405 |
-3,620 |
-6,837 |
-6,986 |
-8,434 |
-9,292 |
0.0 |
0.0 |
|
|
|
See the entire income statement |
1000.0
|
| Tangible assets total | | 94.0 |
70.5 |
47.0 |
23.5 |
0.0 |
0.0 |
0.0 |
0.0 |
|
| Shareholders equity total | | -7,263 |
-8,132 |
-3,580 |
-9,797 |
-5,826 |
-5,302 |
-17,462 |
-17,462 |
|
| Interest-bearing liabilities | | 17,287 |
19,259 |
20,417 |
22,118 |
24,326 |
26,977 |
17,462 |
17,462 |
|
| Balance sheet total (assets) | | 11,745 |
13,508 |
18,562 |
14,246 |
19,412 |
22,694 |
0.0 |
0.0 |
|
|
| Net Debt | | 15,880 |
17,483 |
13,624 |
18,743 |
23,497 |
16,932 |
17,462 |
17,462 |
|
|
See the entire balance sheet |
1000.0
|
| Net sales | | 0 |
0 |
0 |
0 |
0 |
0 |
0 |
0 |
|
| Net sales growth | | 0.0% |
0.0% |
0.0% |
0.0% |
0.0% |
0.0% |
0.0% |
0.0% |
|
| Gross profit | | -226 |
1,024 |
-1,147 |
1,139 |
1,131 |
1,564 |
0.0 |
0.0 |
|
| Gross profit growth | | 53.0% |
0.0% |
0.0% |
0.0% |
-0.8% |
38.4% |
-100.0% |
0.0% |
|
| Employees | | 6 |
2 |
2 |
4 |
5 |
5 |
0 |
0 |
|
| Employee growth % | | -14.3% |
-66.7% |
0.0% |
100.0% |
25.0% |
0.0% |
-100.0% |
0.0% |
|
| Employee expenses | | 0.0 |
0.0 |
0.0 |
0.0 |
0.0 |
0.0 |
0.0 |
0.0 |
|
| Balance sheet total (assets) | | 11,745 |
13,508 |
18,562 |
14,246 |
19,412 |
22,694 |
0 |
0 |
|
| Balance sheet change% | | 10.8% |
15.0% |
37.4% |
-23.3% |
36.3% |
16.9% |
-100.0% |
0.0% |
|
| Added value | | -1,716.0 |
873.4 |
-1,806.5 |
-1,875.7 |
-2,819.5 |
-2,911.0 |
0.0 |
0.0 |
|
| Added value % | | 0.0% |
0.0% |
0.0% |
0.0% |
0.0% |
0.0% |
0.0% |
0.0% |
|
| Investments | | -143 |
-1,435 |
-3,062 |
-3,369 |
-2,802 |
-2,341 |
-10,190 |
0 |
|
|
| Net sales trend | | 0.0 |
0.0 |
0.0 |
0.0 |
0.0 |
0.0 |
0.0 |
0.0 |
|
| EBIT trend | | -3.0 |
-4.0 |
-5.0 |
-5.0 |
-5.0 |
-5.0 |
0.0 |
0.0 |
|
1000.0
| EBITDA % | | 0.0% |
0.0% |
0.0% |
0.0% |
0.0% |
0.0% |
0.0% |
0.0% |
|
| EBIT % | | 0.0% |
0.0% |
0.0% |
0.0% |
0.0% |
0.0% |
0.0% |
0.0% |
|
| EBIT to gross profit (%) | | 1,545.0% |
-149.7% |
417.5% |
-454.9% |
-541.9% |
-417.7% |
0.0% |
0.0% |
|
| Net Earnings % | | 0.0% |
0.0% |
0.0% |
0.0% |
0.0% |
0.0% |
0.0% |
0.0% |
|
| Profit before depreciation and extraordinary items % | | 0.0% |
0.0% |
0.0% |
0.0% |
0.0% |
0.0% |
0.0% |
0.0% |
|
| Pre tax profit less extraordinaries % | | 0.0% |
0.0% |
0.0% |
0.0% |
0.0% |
0.0% |
0.0% |
0.0% |
|
| ROA % | | -18.7% |
-7.5% |
-21.8% |
-22.4% |
-24.9% |
-24.5% |
0.0% |
0.0% |
|
| ROI % | | -21.3% |
-8.4% |
-24.0% |
-24.2% |
-26.3% |
-25.4% |
0.0% |
0.0% |
|
| ROE % | | -39.6% |
-22.1% |
-38.1% |
-37.9% |
-44.7% |
-39.0% |
0.0% |
0.0% |
|
1000.0
| Equity ratio % | | -38.2% |
-37.6% |
-16.2% |
-40.7% |
-23.1% |
-18.9% |
-100.0% |
-100.0% |
|
| Relative indebtedness % | | 0.0% |
0.0% |
0.0% |
0.0% |
0.0% |
0.0% |
0.0% |
0.0% |
|
| Relative net indebtedness % | | 0.0% |
0.0% |
0.0% |
0.0% |
0.0% |
0.0% |
0.0% |
0.0% |
|
| Net int. bear. debt to EBITDA, % | | -925.4% |
2,001.7% |
-754.2% |
-999.2% |
-879.9% |
-581.7% |
0.0% |
0.0% |
|
| Gearing % | | -238.0% |
-236.8% |
-570.3% |
-225.8% |
-417.5% |
-508.8% |
-100.0% |
-100.0% |
|
| Net interest | | 0 |
0 |
0 |
0 |
0 |
0 |
0 |
0 |
|
| Financing costs % | | 11.7% |
11.4% |
10.4% |
8.5% |
9.9% |
10.8% |
0.0% |
0.0% |
|
1000.0
| Quick Ratio | | 0.5 |
0.5 |
6.2 |
3.2 |
7.7 |
0.4 |
0.0 |
0.0 |
|
| Current Ratio | | 0.6 |
0.6 |
6.5 |
3.4 |
8.0 |
0.4 |
0.0 |
0.0 |
|
| Cash and cash equivalent | | 1,407.6 |
1,776.3 |
6,793.1 |
3,374.8 |
829.3 |
10,045.3 |
0.0 |
0.0 |
|
1000.0
| Trade debtors turnover (days) | | 0.0 |
0.0 |
0.0 |
0.0 |
0.0 |
0.0 |
0.0 |
0.0 |
|
| Trade creditors turnover (days) | | 0.0 |
0.0 |
0.0 |
0.0 |
0.0 |
0.0 |
0.0 |
0.0 |
|
| Current assets / Net sales % | | 0.0% |
0.0% |
0.0% |
0.0% |
0.0% |
0.0% |
0.0% |
0.0% |
|
| Net working capital | | -3,318.8 |
-3,706.3 |
8,525.2 |
4,155.7 |
9,082.2 |
-15,483.0 |
-8,730.8 |
-8,730.8 |
|
| Net working capital % | | 0.0% |
0.0% |
0.0% |
0.0% |
0.0% |
0.0% |
0.0% |
0.0% |
|
1000.0
| Net sales / employee | | 0 |
0 |
0 |
0 |
0 |
0 |
0 |
0 |
|
| Added value / employee | | -286 |
437 |
-903 |
-469 |
-564 |
-582 |
0 |
0 |
|
| Employee expenses / employee | | 0 |
0 |
0 |
0 |
0 |
0 |
0 |
0 |
|
| EBITDA / employee | | -286 |
437 |
-903 |
-469 |
-534 |
-582 |
0 |
0 |
|
| EBIT / employee | | -583 |
-766 |
-2,395 |
-1,296 |
-1,225 |
-1,307 |
0 |
0 |
|
| Net earnings / employee | | -737 |
-1,395 |
-3,056 |
-1,554 |
-1,506 |
-1,643 |
0 |
0 |
|
|